Your browser does not seem to support JavaScript. As a result, your viewing experience will be diminished, and you have been placed in read-only mode.
Please download a browser that supports JavaScript, or enable it if it's disabled (i.e. NoScript).
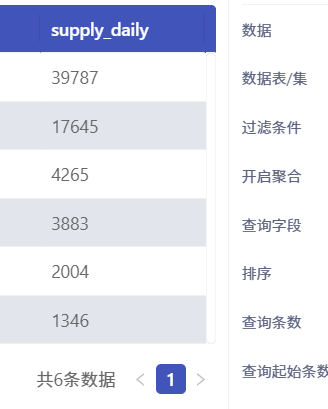
这是数据源里的数据
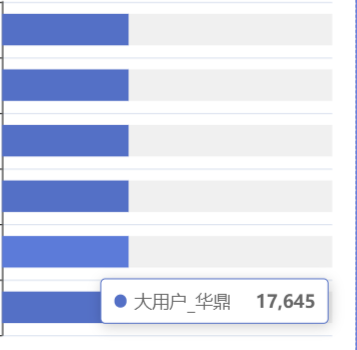
这是图表显示的样子,鼠标悬停显示的数据是对的,但数据柱和排序都不对,是哪里配置的有问题
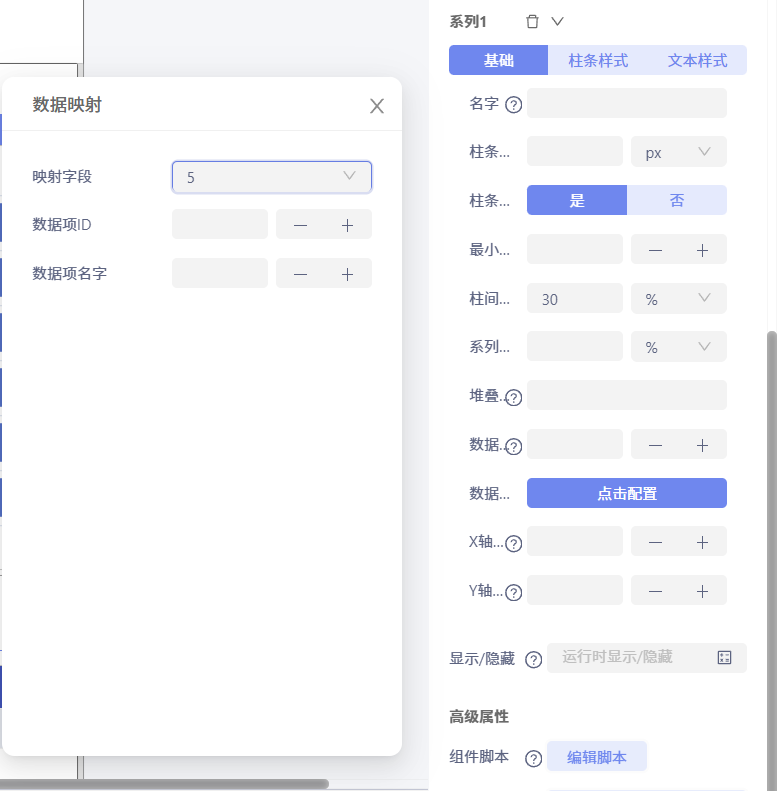
你的柱形图系列怎么配置的,是否自己写了代码图表
就一个系列,没写代码
发个地址我看一下你这个画面
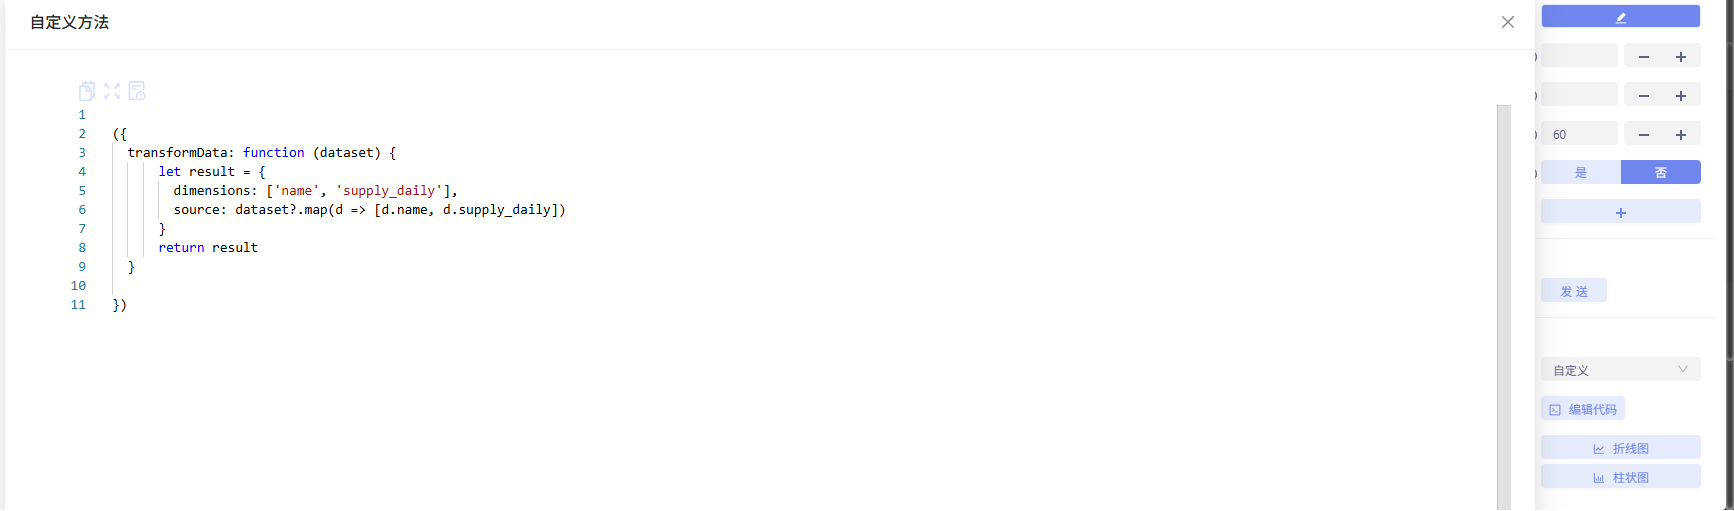
1.数据源需要对数据进行处理
({ transformData: function (dataset) { let result = { dimensions: ['name', 'supply_daily'], source: dataset?.map(d => [d.name, d.supply_daily]) } return result }
}) 柱状图重新系列需要重新添加一个,然后在吧之前的删除
 就一个系列,没写代码